An Overview of a Tilia File
The Data Tab
The Data Tab is the first panel you see when you create a new file. The Data tab will be the main location for the raw data collected at a site or collection unit within a site.
The upper left cell of the Data tab indicates the type of data the spreadsheet is storing in the following rows (e.g., ‘pollen’, ‘vertebrate fauna’, ‘diatoms’).
The Data tab is organized in a Column/Row format, where rows represent variables and the columns are for each individual stratum or sample within the collection unit (e.g., there would be a row for Pinus pollen, with each column (starting with column H) representing depths within a sediment core). Additional information about the samples is stored in the first set of columns (A:G).
Three fixed columns are visible immediately when you open a new document: “Code”, “Name” and “Group”. There are additional columns (“Elements”, “Units”, “Context”, and “Taphonomy”) that are also available by selecting Tools > Options and clicking the checkboxes within the “Show Columns” section.
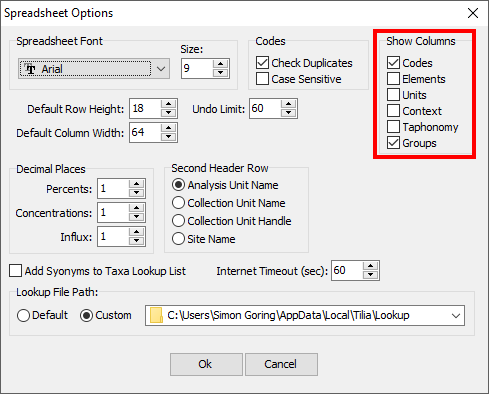
Spreadsheet options for the data tab. You can make extra variable-related columns visible using Tools > Options
Columns
- Codes
- Variables are assigned shortened “codes” for identification. These codes are associated with the Lookup Table for a particular dataset type. For example, Asarum (wild ginger) is associated with the code “Asu”.
- Element
- Varies based on dataset type (“Pollen”, “Vertebrate Fauna”, &cetera).
- Units
- Varies based on dataset type (“Pollen”, “Vertebrate Fauna”, &cetera).
- Context
- Varies based on dataset type (“Pollen”, “Vertebrate Fauna”, &cetera).
- Taphonomy
- Varies based on dataset type (“Pollen”, “Vertebrate Fauna”, &cetera).
- Groups
- Varies based on dataset type (“Pollen”, “Vertebrate Fauna”, &cetera).
Specimen Information
The presence or absence of specimen-level data is also indicated within the main data tab by the color of the cell: pink cells have associated specimen-level data. To view or enter the specimen information, right click on the cell and select ‘specimens’.
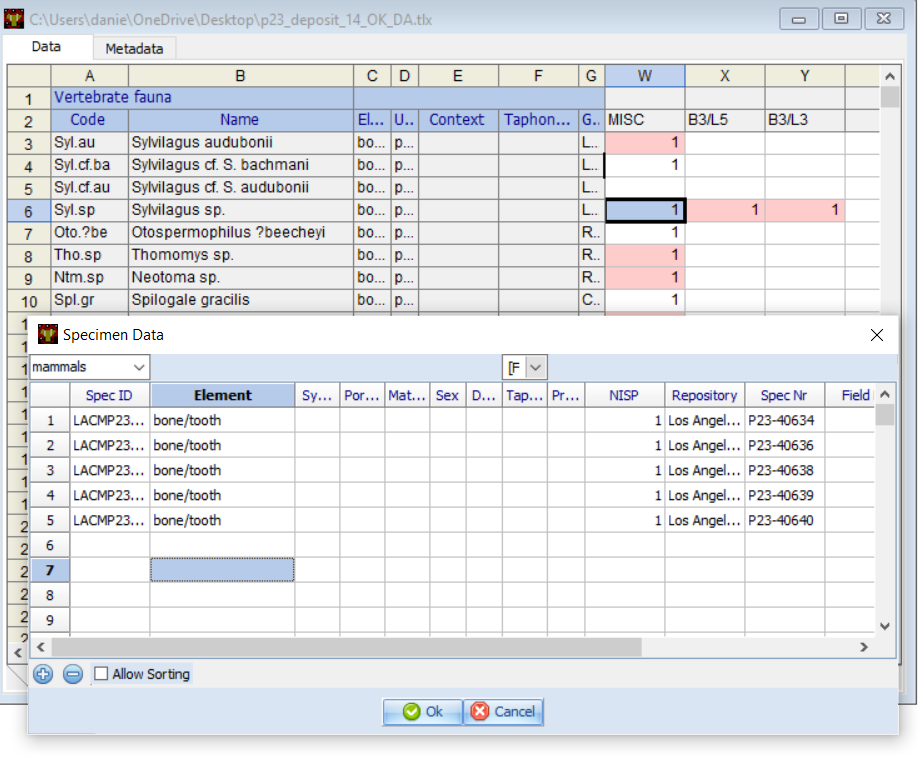
Analysis units and taxa that have associated specimen-level data are indicated in pink. Right clicking on the cell and selecting ‘specimens’ brings up a view of the specimen-level data.
The Metadata Tab
The Metadata Tab is where you put information about the dataset that is not explicitly raw data. This includes information about the spatial location, the collection unit itself, the particular dataset, the geochronological data associated with the record, how that geochronological data was used to construct a chronology, the lithology, a special tab for Loss on Ignition sampling, contact information and associated publications. These entries are intended to help you navigate through the tabs so that you understand what is expected of you. We will learn how to enter data in each tab further down in this guide.
Site
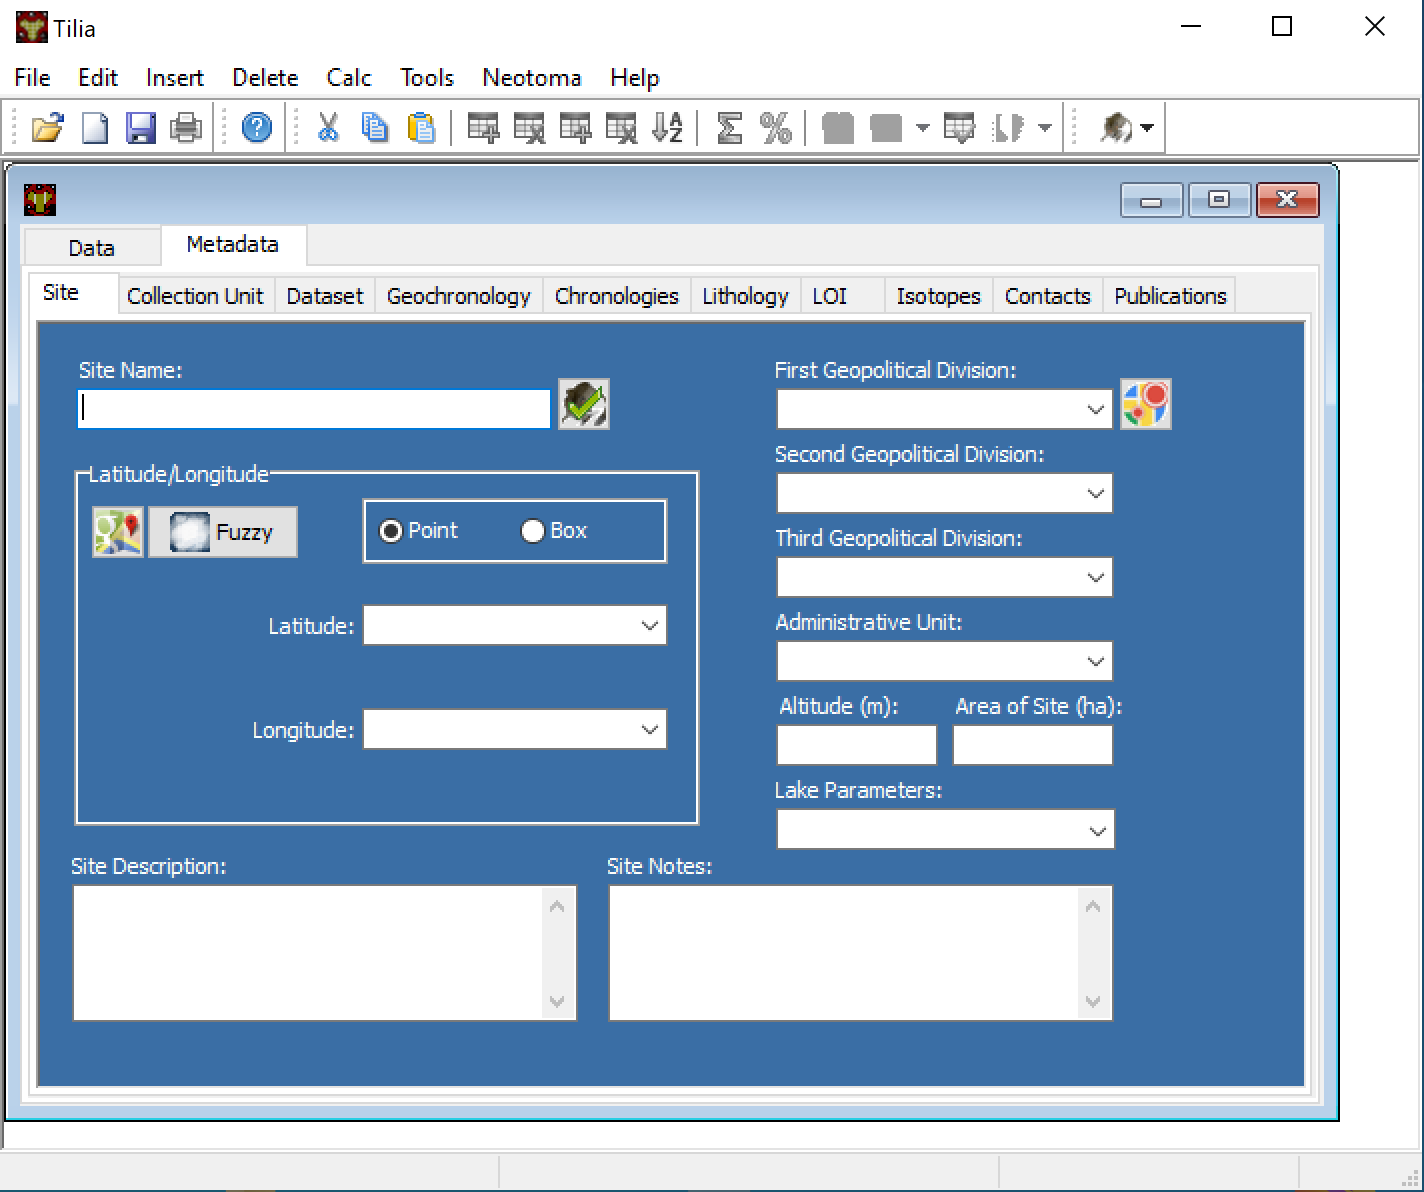
The “Site” metadata tab.
Collection Unit
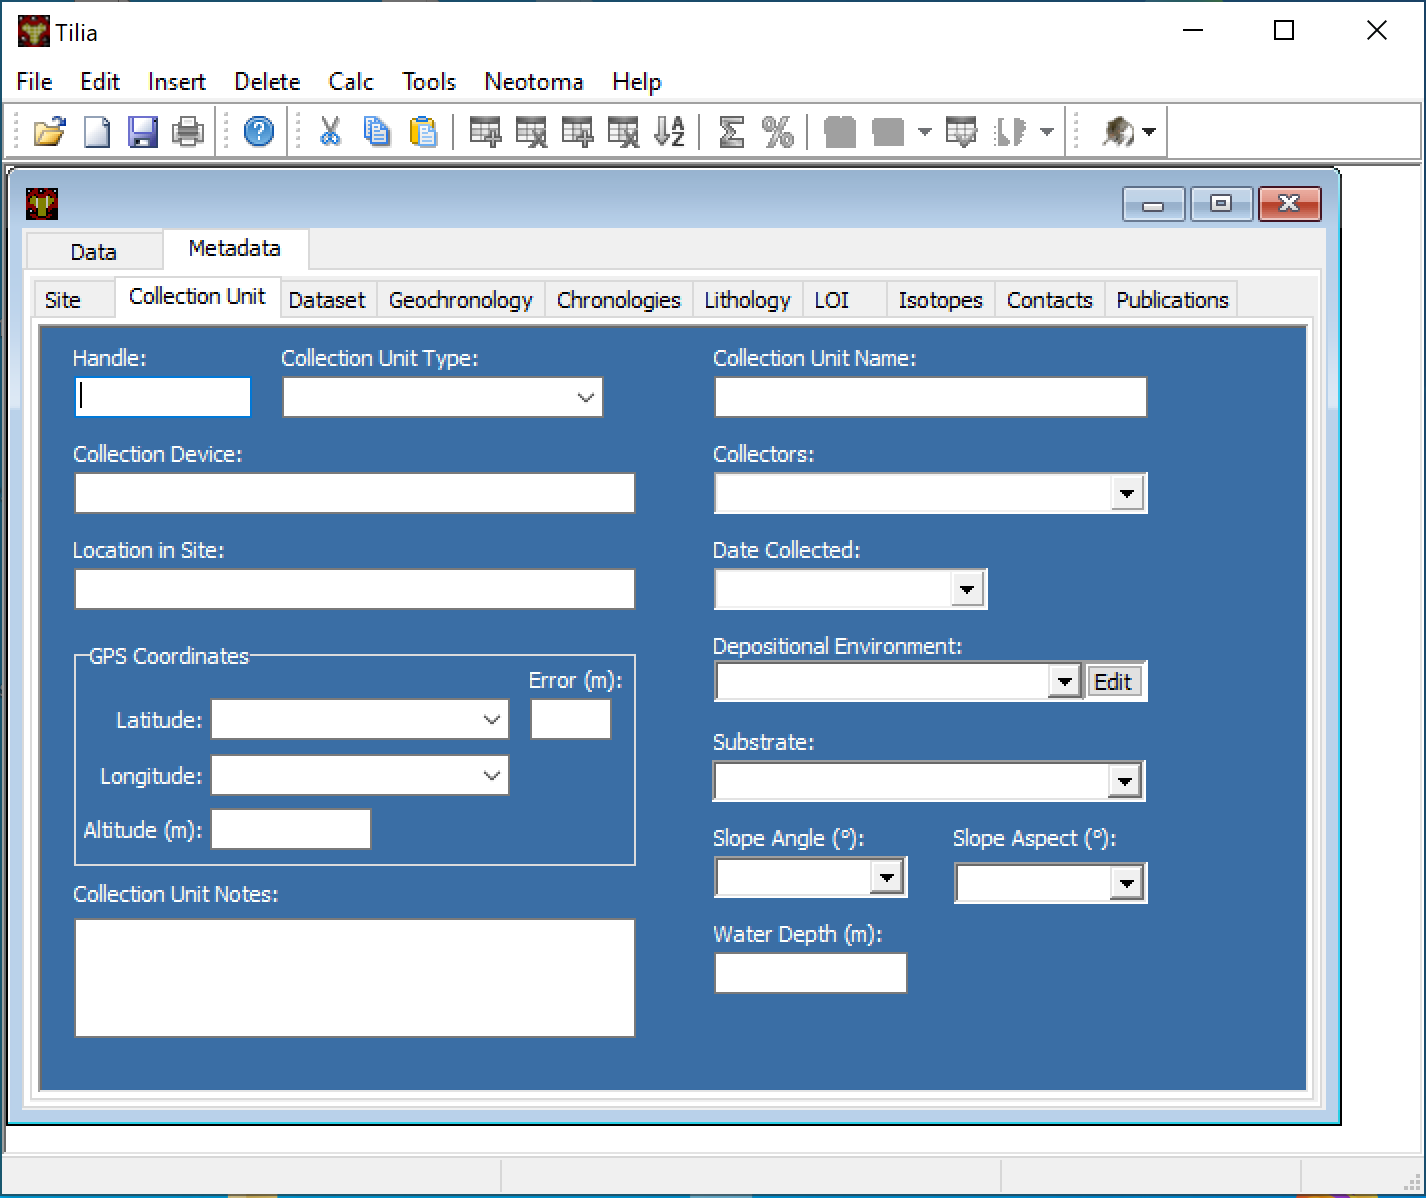
The “Collection Unit” metadata tab.
Dataset
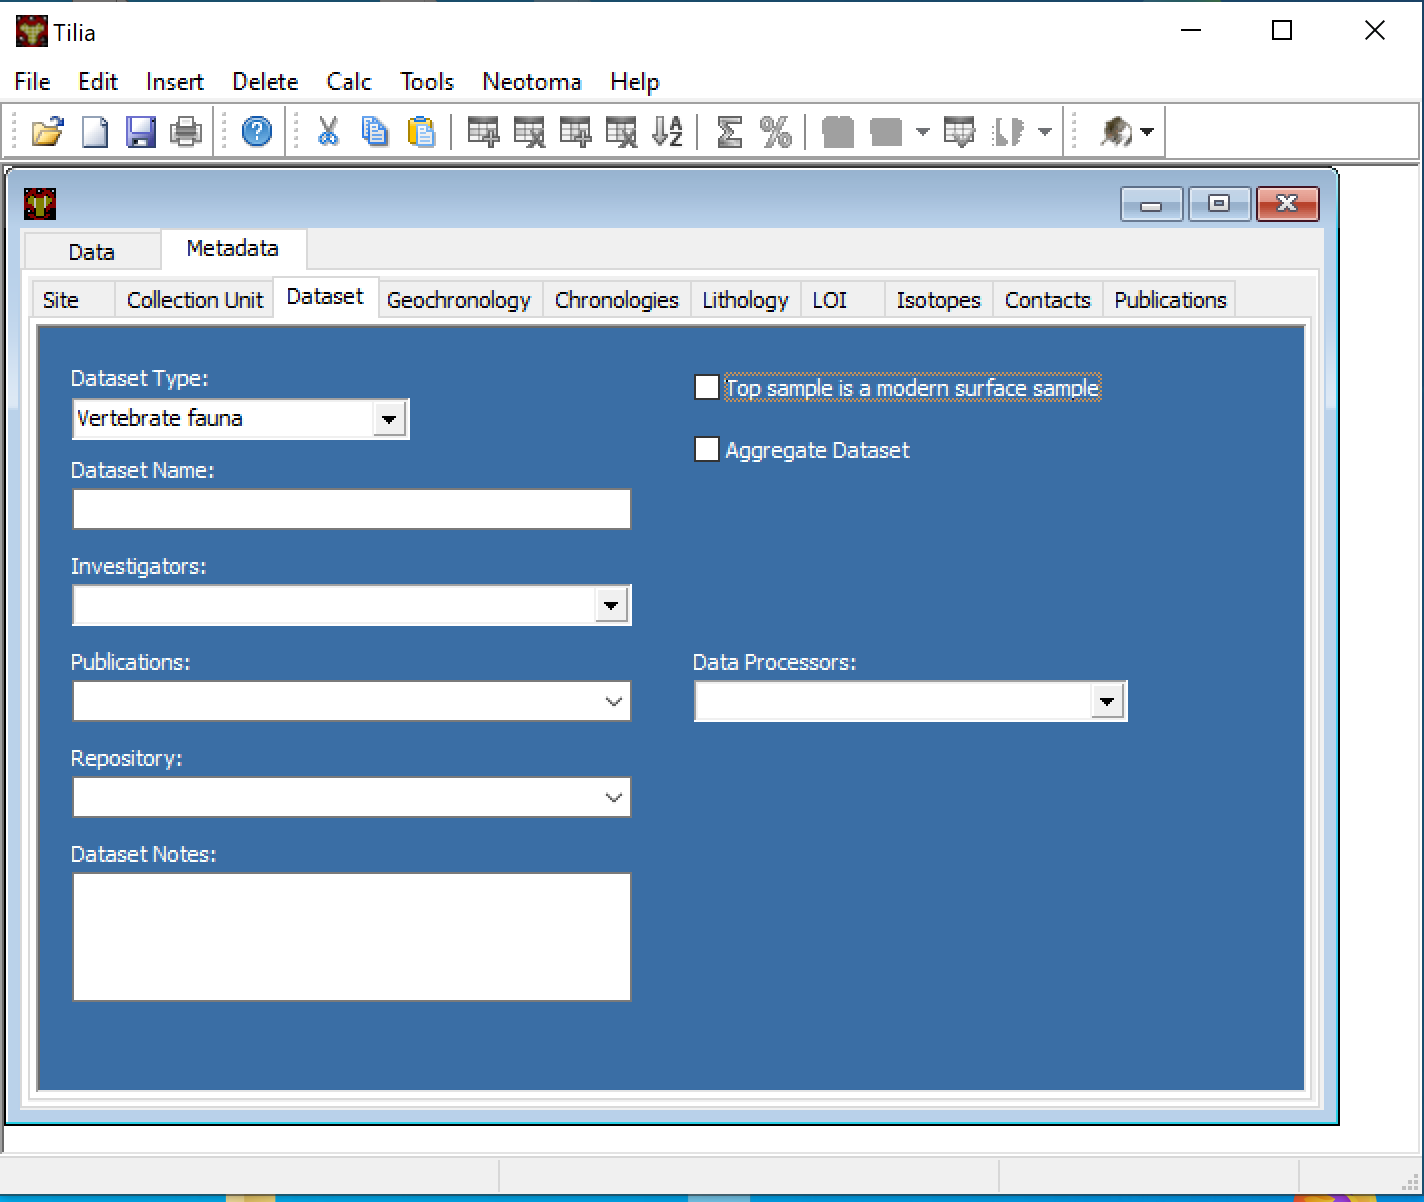
The “Dataset” metadata tab.
Geochronology
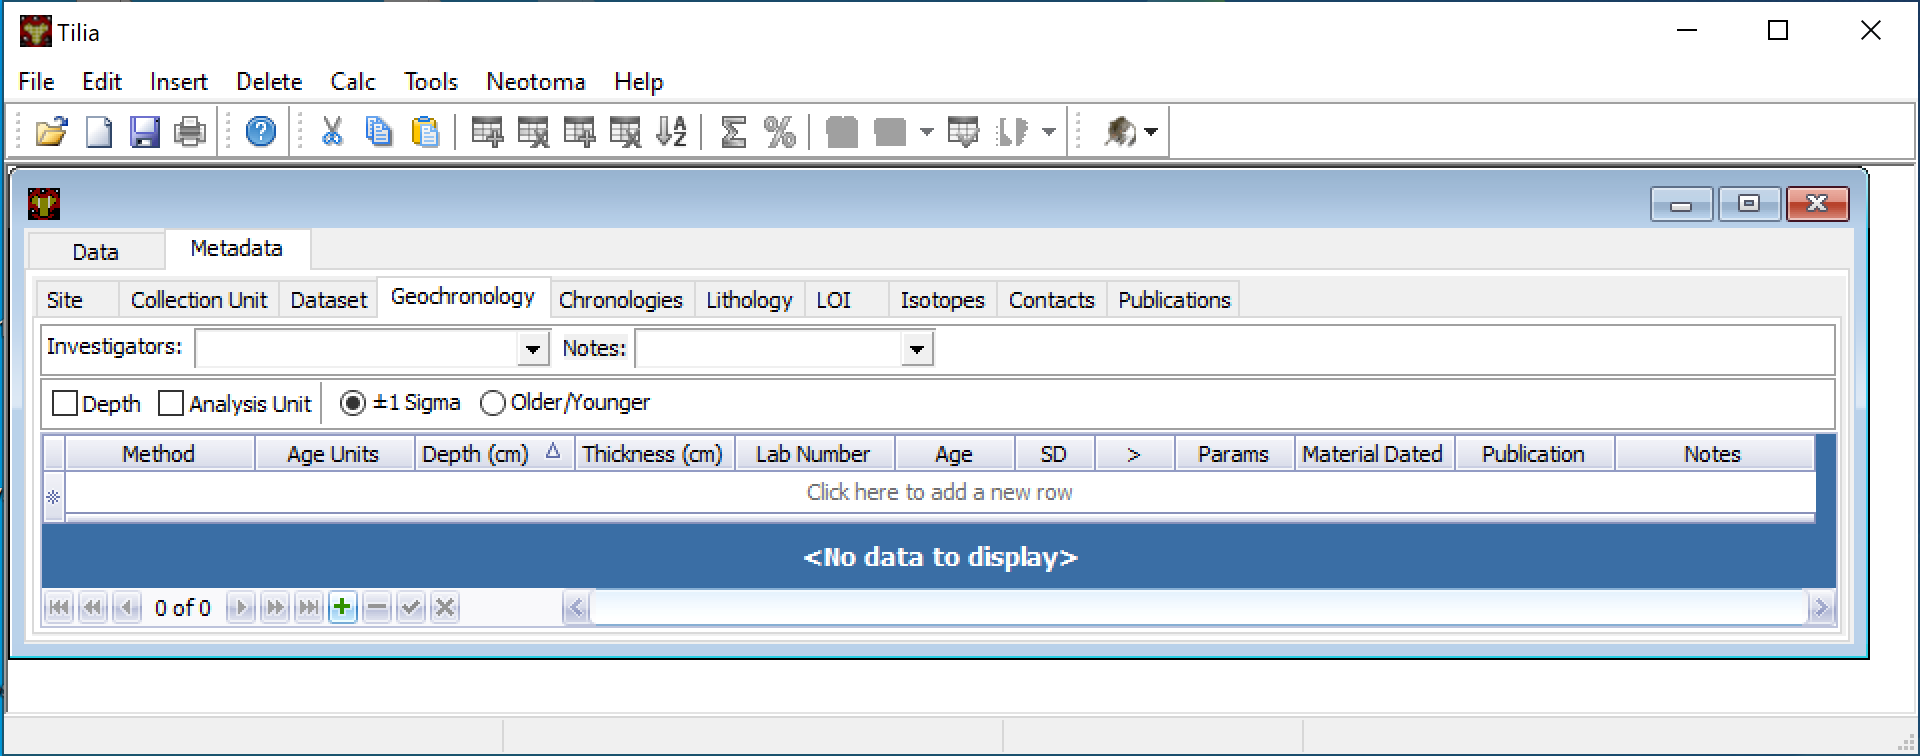
The “Geochronology” metadata tab.
Chronologies
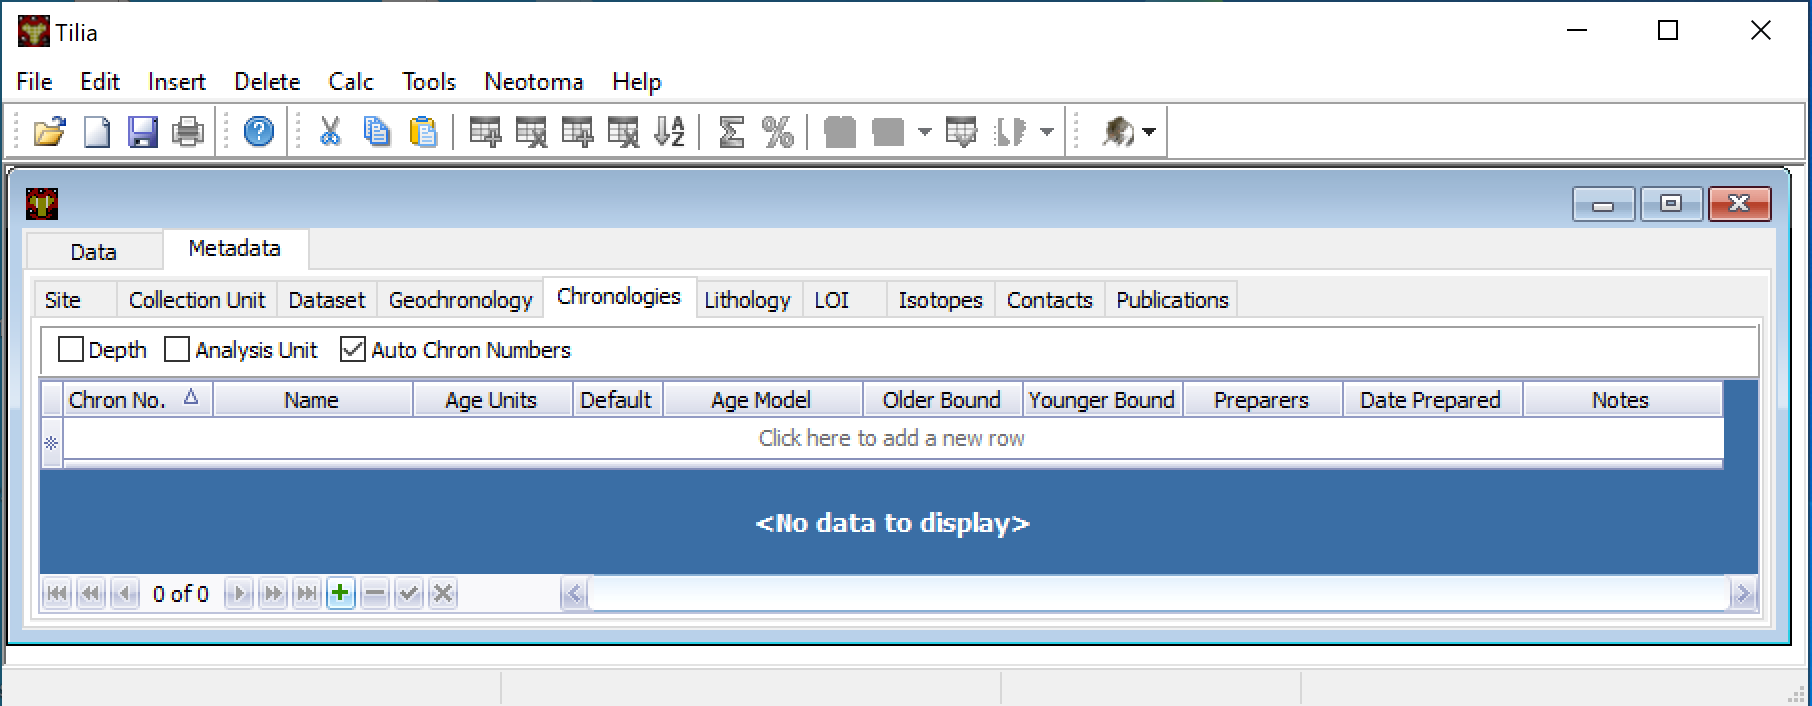
The “Chronologies” metadata tab.
Lithology
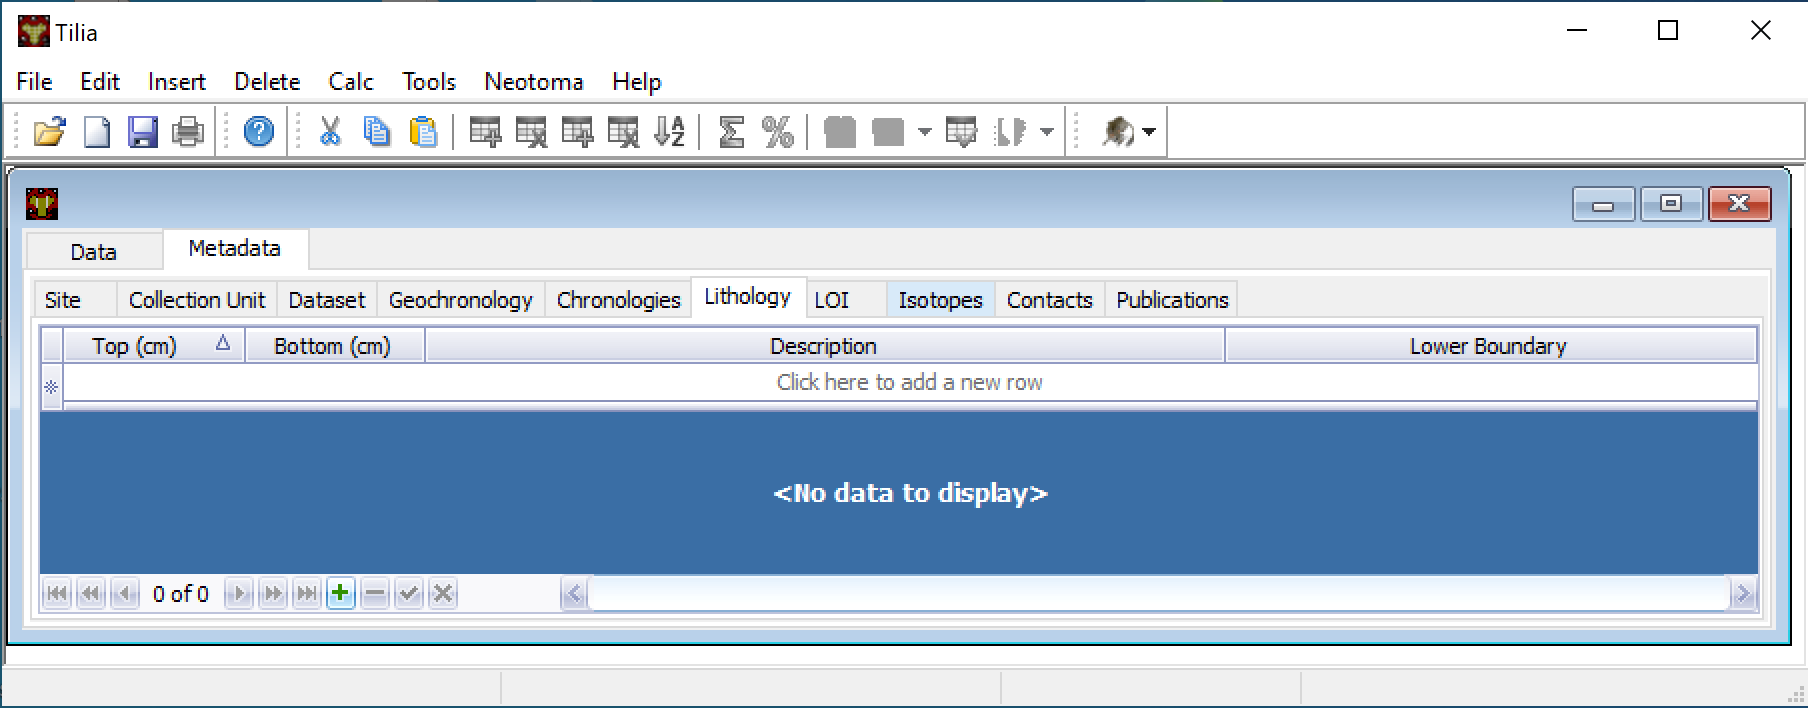
The “Lithology” metadata tab.
LOI
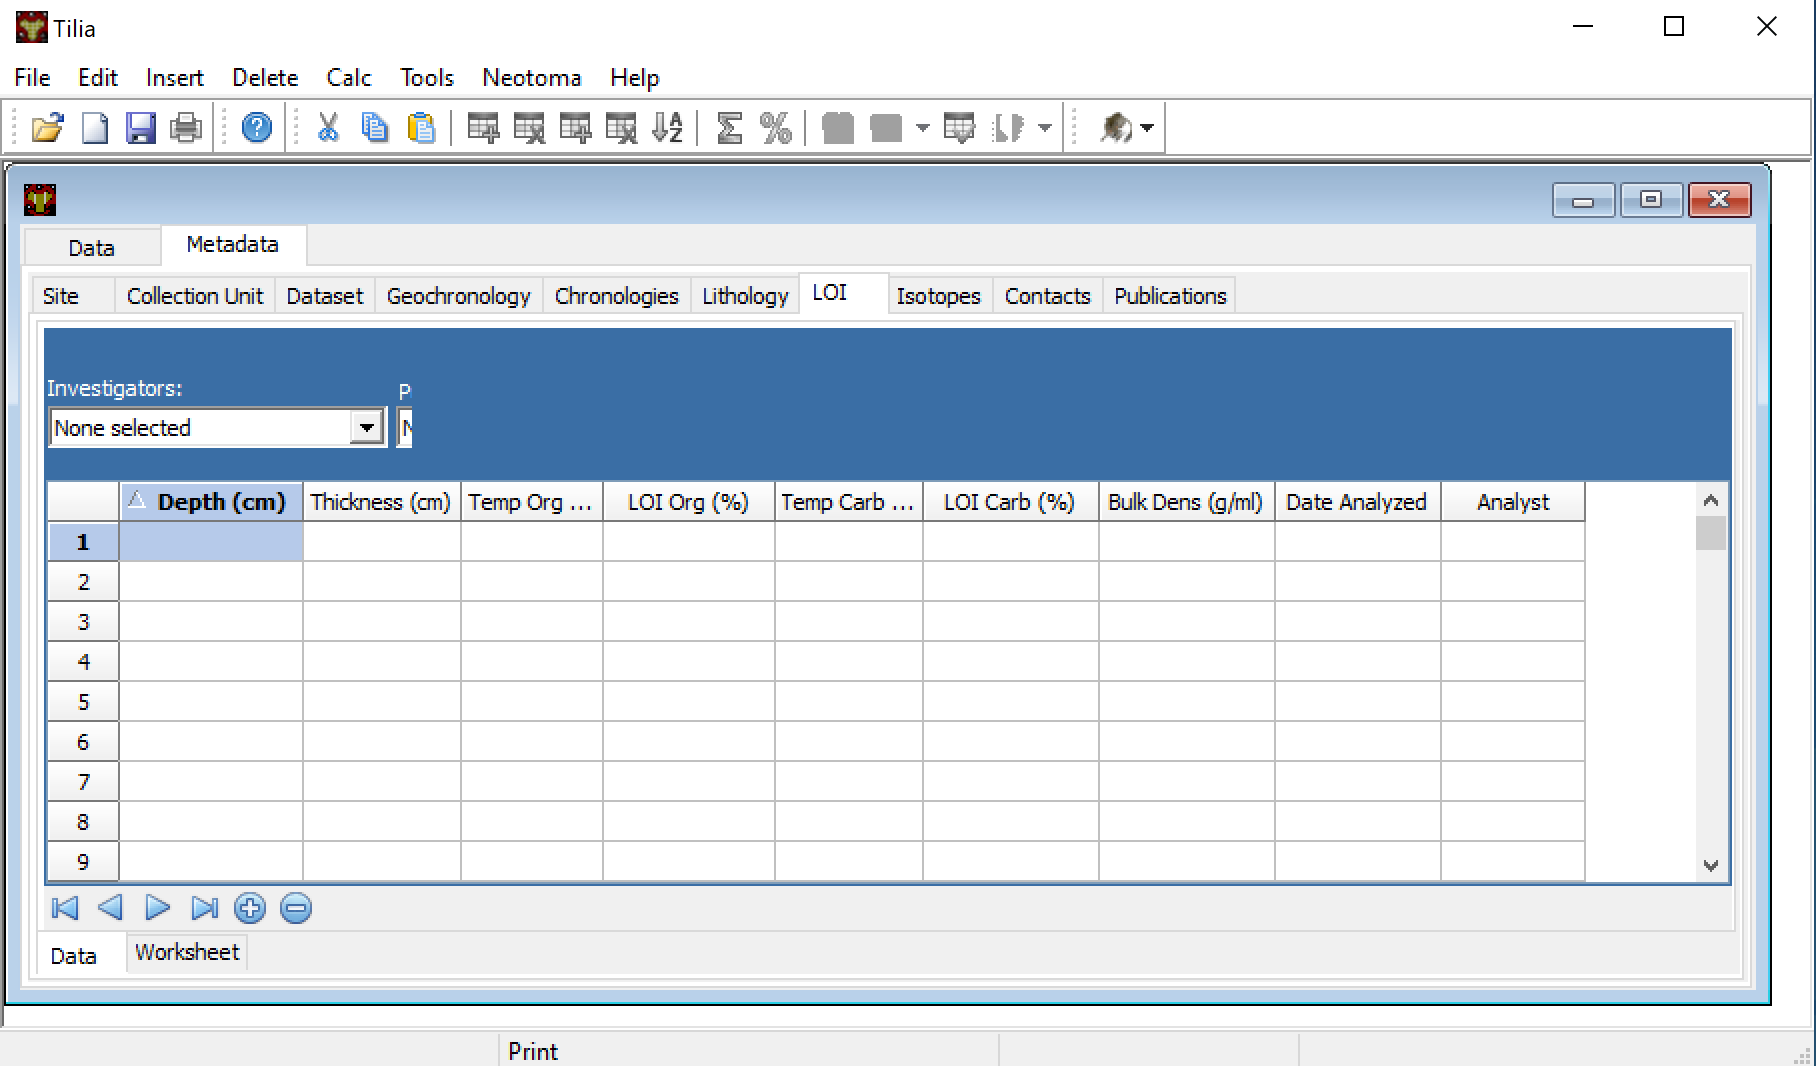
The “LOI” metadata tab (very different from the LOL tab).
Isotopes
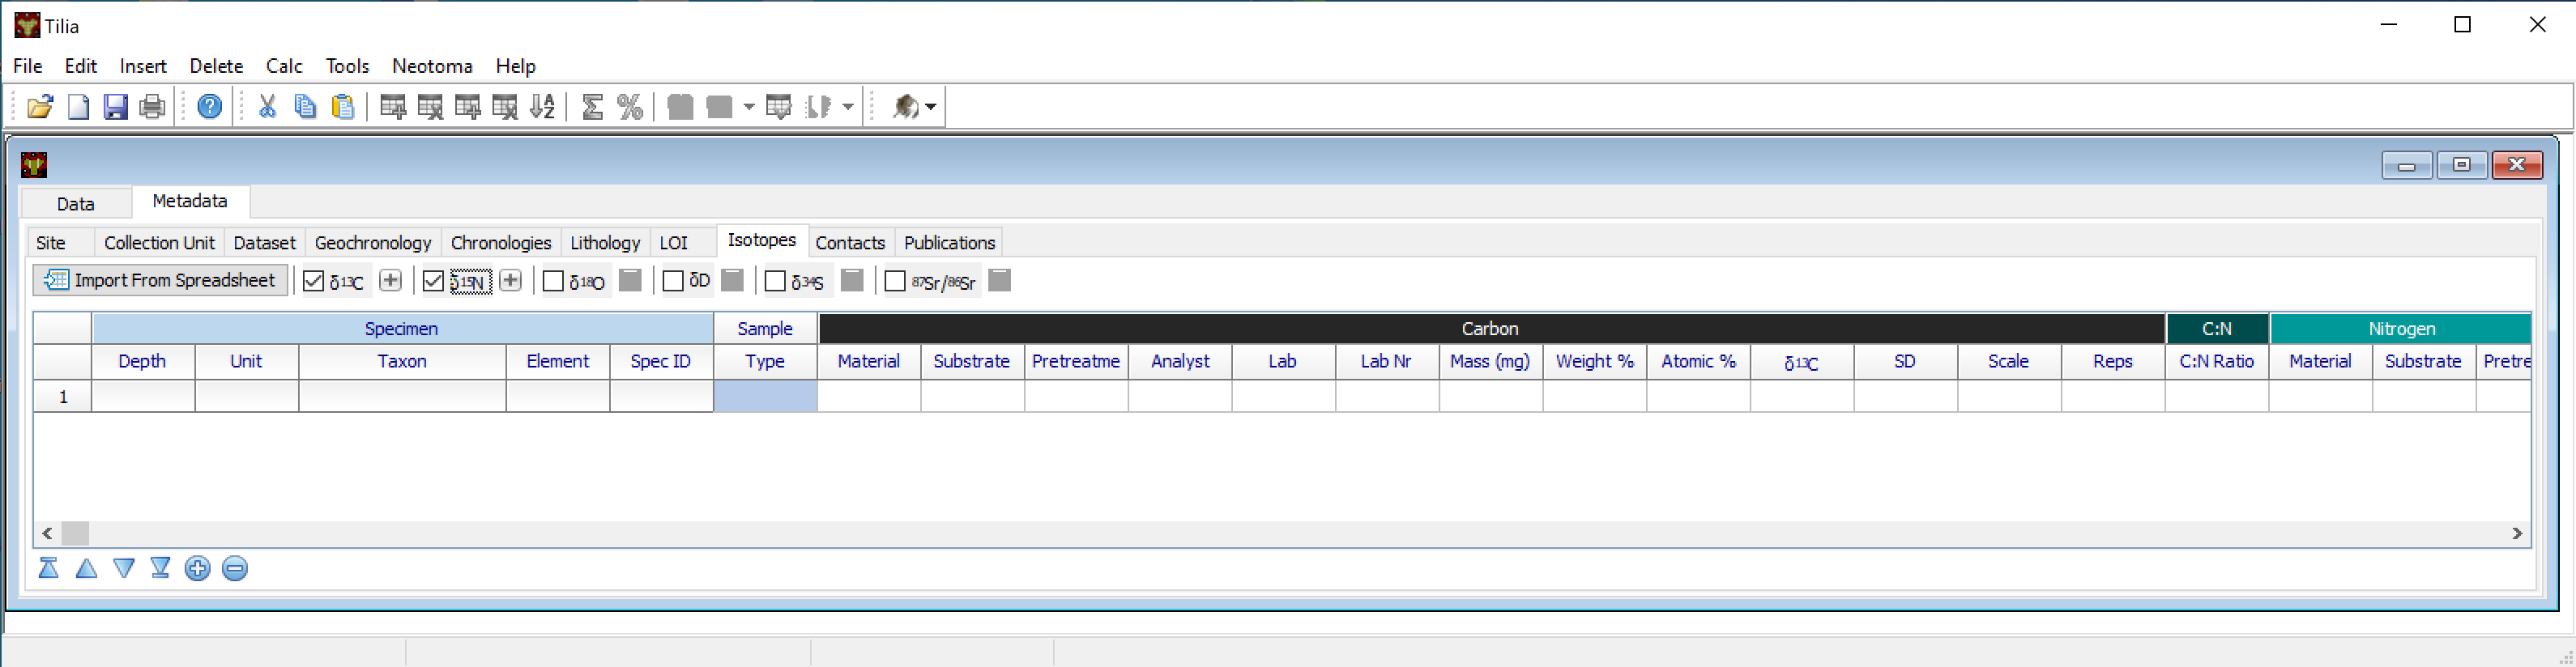
The “Isotopes” metadata tab.
Contacts
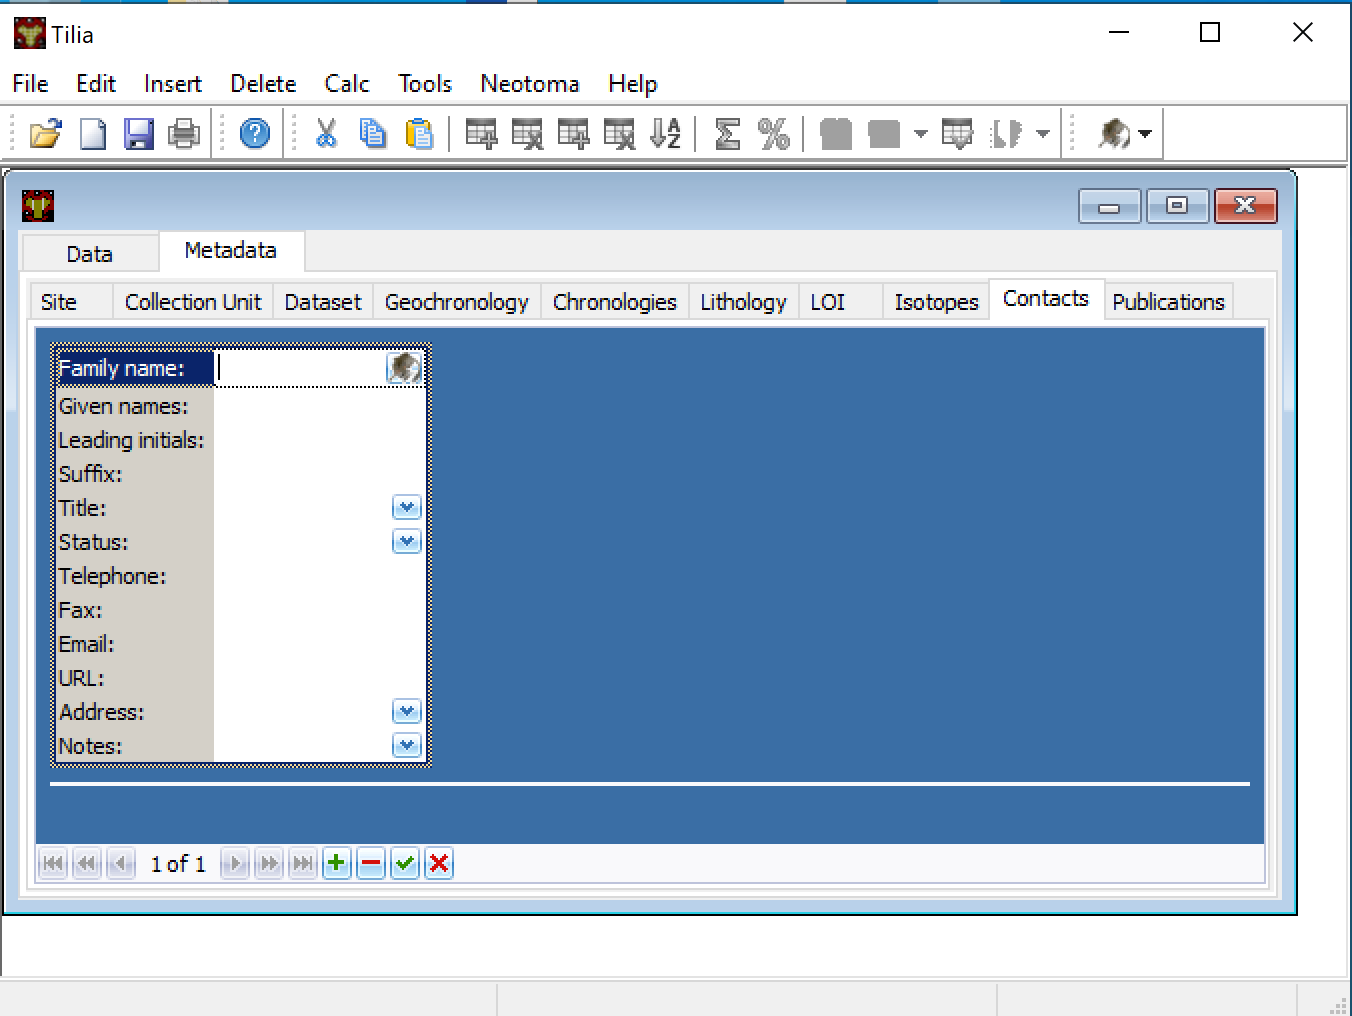
The “Contacts” metadata tab.
Publications
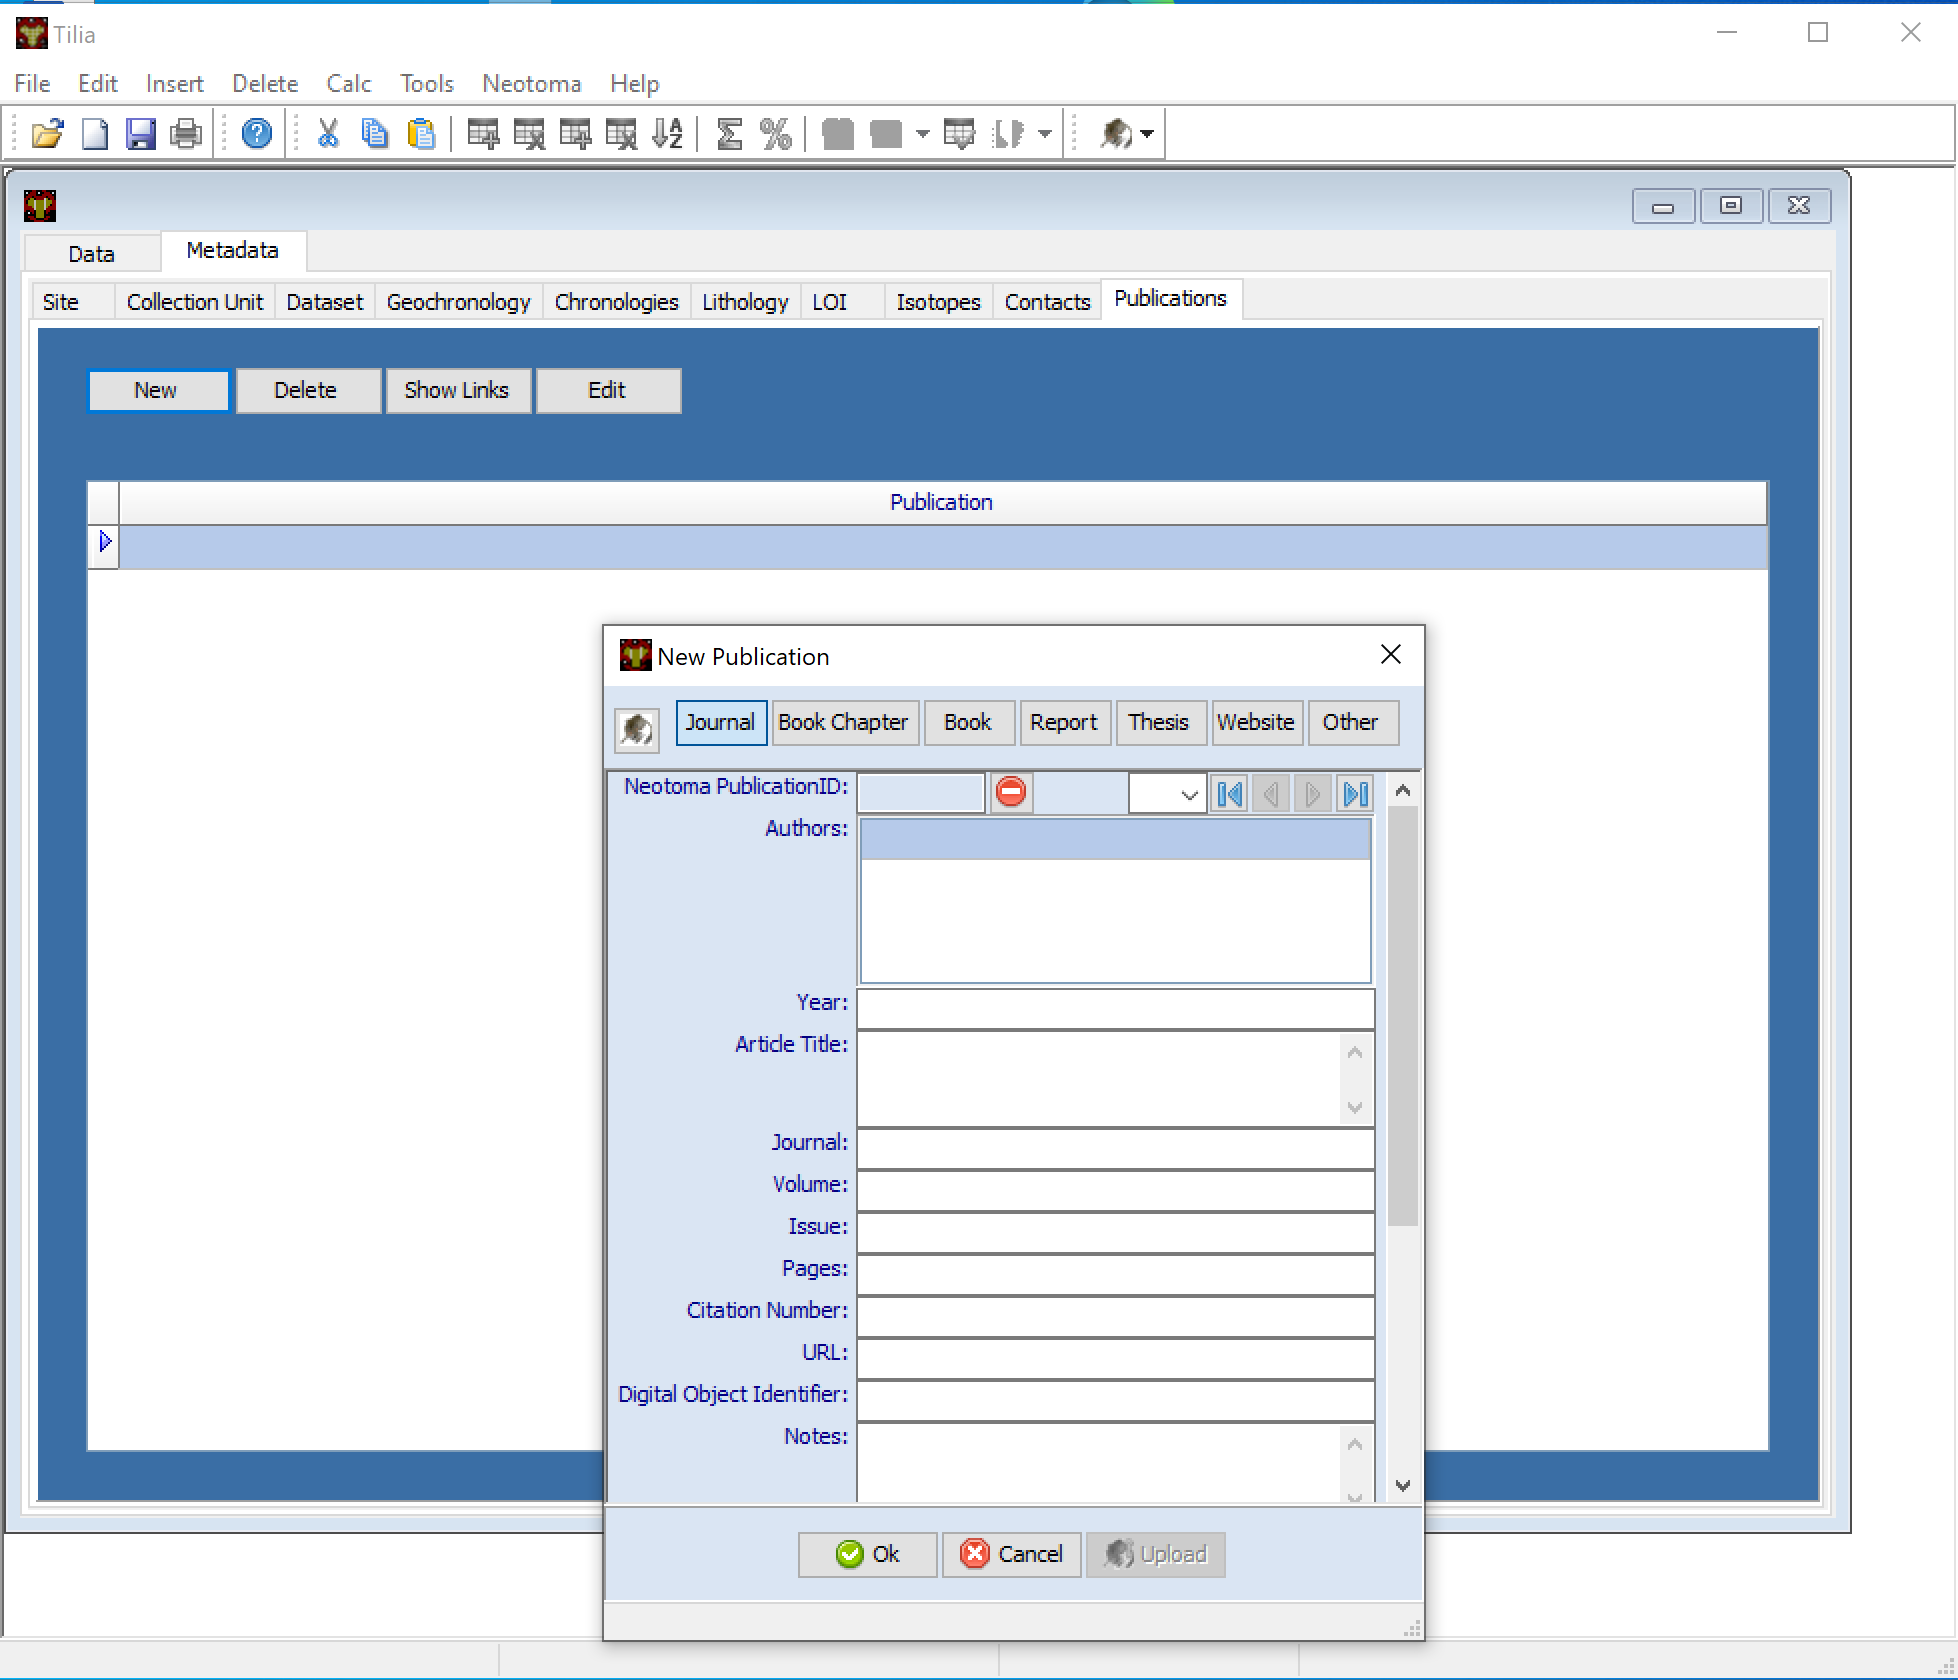
The “Publications” metadata tab.